Do you know how to view a project’s activity, traffic and contributions?
Updated by Brady Stroud [SSW] 1 year ago. See history
When you have a public project in GitHub you have some graphs available that give you some statistics helping you to understand who is using your project and why they are using it. These graphs can be found under the Insights tab.

Figure: Under your project name, click Insights
Read more about the project’s graphs: https://help.github.com/en/github/visualizing-repository-data-with-graphs/about-repository-graphs
Some project graphs available:
Pulse Graph
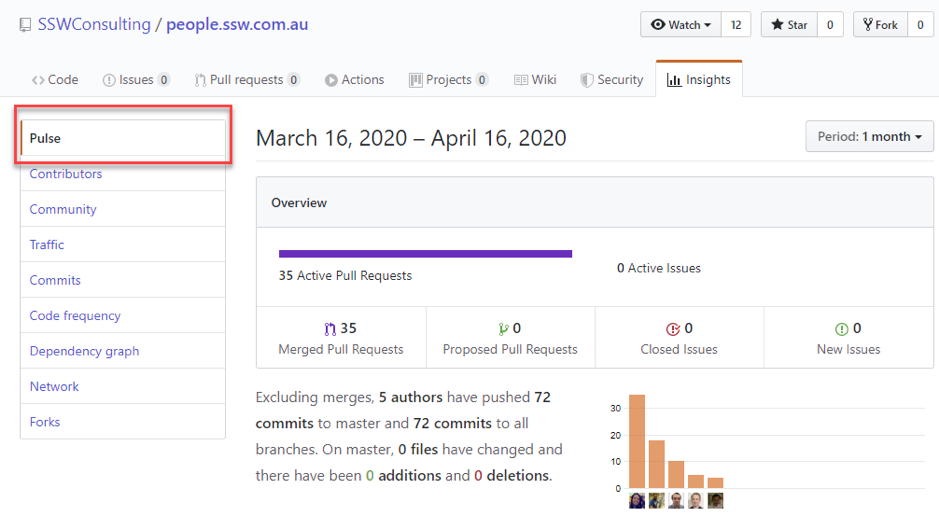
Figure: Pulse graph shows a summary of the project activity
Read more about Pulse Graph : https://help.github.com/en/github/visualizing-repository-data-with-graphs/viewing-a-summary-of-repository-activity
Contributors Graph
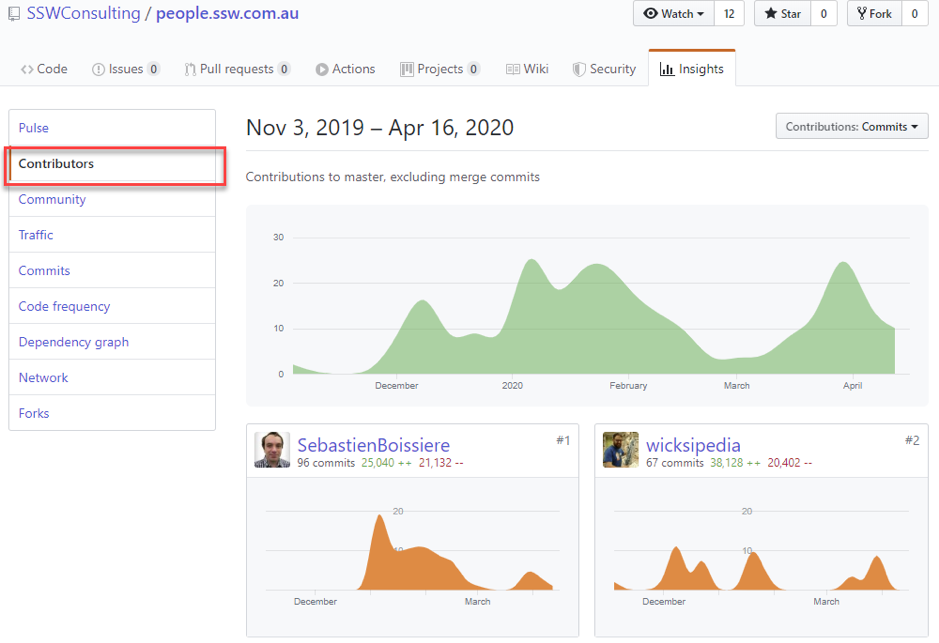
Figure: Contributors graphs show the top 100 contributors to the project
Read more about Contributors Graph : https://help.github.com/en/github/visualizing-repository-data-with-graphs/viewing-a-projects-contributors
Traffic Graph
Figure: Traffic graphs show the project’s traffic, including clones, visitors in the past 14 days, referring sites and popular content to anyone with push access to the project
Read more about Traffic Graph : https://help.github.com/en/github/visualizing-repository-data-with-graphs/viewing-traffic-to-a-repository